Projects
Professional projects
GT Benchmarking
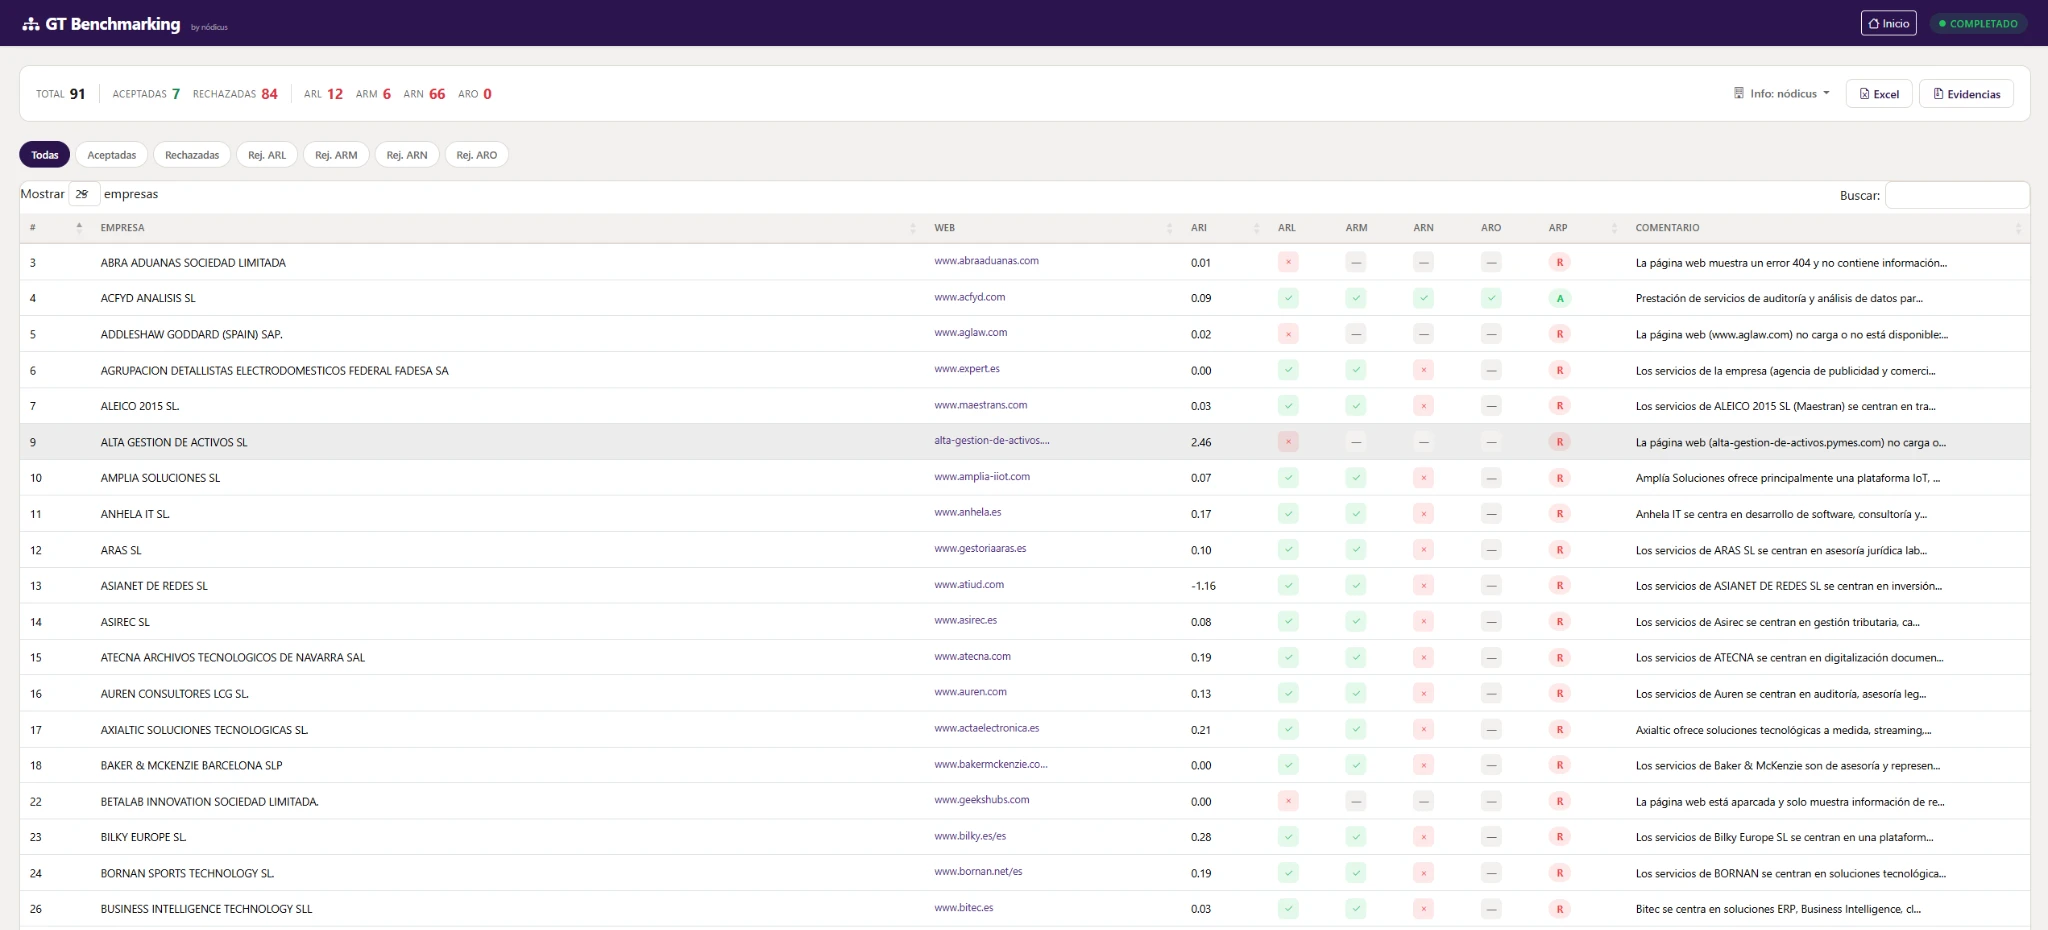
At LLMthon Legal 2026 each company set a challenge, and Pedro (my partner at nódicus) and I went for Grant Thornton's, which was about automating transfer pricing benchmarking.
For those of you who aren't familiar with it, when a company sells something to another company in its own group, the tax authorities want to check that the price is a market price. To prove it you look for comparable companies, and this is where the heavy lifting is. Someone has to go into each one's website, check what it really does and whether it belongs to a group, and save screenshots as evidence. One by one.
So we built a tool that does that work on its own. You give it the company under analysis and its services, and it goes into each candidate's website and applies the qualitative filters one after another. For example, whether the website works, what the company does, what kind of service it offers or whether it's part of a multinational group. With that it decides whether to accept or reject it, and every decision comes with its reasoning and its screenshots, so anyone can check why it was made.
That said, the analyst always has the last word. They can change any decision and explain why, and the AI carries on from there. At the end you get the Excel in Grant Thornton's format and a zip with all the evidence.
With this we analysed 91 companies in a few minutes and won the challenge. And the best part is that the analyst can spend their time on what matters, which is analysing, and not on opening tabs one after another.
- 1st prize in Grant Thornton's challenge
- 91 companies analysed in a few minutes
- 4 filters, each one with its reasoning
Go to nodicus.com
R-HDBSCAN
During my time at the Diputació de València we worked with data from sensors that detect how many people pass through different areas of Valencia and the Valencian Community, and from there we were able to work out how many people travel from one municipality to another.
For those of you who aren't familiar with it, the idea is to see the region as a graph, where each municipality is a point and each pair of municipalities is joined by an edge. And the goal was for the weight of each edge to really reflect how many people go from one to the other, so that it matched what the sensors detect.
The first step was to put the data in order. We split it into 10-minute windows and, for each pair of municipalities, calculated the trips over 20 and 40 minutes, an hour, a day and a week. We also added everything that could help explain each one, such as the physical, walking and driving distance, the detections at origin and destination, the date and time, whether it was a public holiday and the coordinates of both municipalities.
And this is where R-HDBSCAN comes in. HDBSCAN is an algorithm that groups data points that look alike without you having to tell it how many groups you want (very handy when you have no idea how many there are). The problem is that, with so much data and so varied, it can easily give you groups too big to tell you anything useful. So we made it recursive. You train HDBSCAN, tune the parameters and apply it again to the groups that come out, and so on until you're left with small groups that have the characteristics you're after. In fact, we trained one for each time horizon, from 20 minutes to a week.
On top of that, once the groups are built, any new data point that comes in can be assigned to the group it belongs to.
Warranty coding with AI
This is one of the projects we've done at nódicus, for a truck workshop. To get paid for a warranty repair, the truck manufacturer isn't happy with an explanation of what you did. It wants every job classified in a tree of over 12,000 codes per truck, and if you get it wrong, the warranty doesn't get paid.
Looking those codes up by hand takes a good while and, with so many options, mistakes are very easy to make. So we built an assistant that reads the workshop's job report and proposes the codes that fit, each one with its confidence level.
The first version tried to do what a person would do. It was a LangGraph agent that went into the tree, opened and closed folders, searched by meaning and by keyword, and kept the codes that fitted. It even wrote the work procedure for the mechanic.
But then we turned it around. Almost everything a workshop does has been done before, so the final version starts by looking for precedents in what the workshop itself already validated. Then it has three language models read the report separately and only keeps the codes they agree on. In fact, if a code isn't backed by a precedent or by the models agreeing, it's thrown out, because proposing eight good codes is far more useful than twenty you have to choose from.
On top of that, the reviewer no longer starts from scratch. They confirm, remove what doesn't belong and add what's missing, and the last word is still theirs. And every report they validate goes into the history, so the system gets better with use without retraining anything.
As for the numbers, it finds 72% of the correct codes (the target was 65%), gets right every code it proposes with 90% confidence or more and takes 40 to 80 seconds per report, when the target was two minutes. All for under 10 cents per report. And it's already in production.
- 72% of the correct codes (target: 65%)
- 40-80 s per report (target: 2 min)
- < €0.10 per report
Go to nodicus.com
Sales visit reports with AI
Another nódicus project was for a distributor with its own sales team. A salesperson only sells when they're in front of a customer, but here every week of visits was followed by another at the office, writing the reports, entering everything into the database and preparing the next visits.
And that work is needed, because otherwise nobody knows what was discussed with each customer or what's still pending. The problem is that it doesn't sell, so when it piles up, reports get written late, short or not at all.
We solved it with something as simple as an audio note. On leaving the customer, the salesperson records what happened, the way they'd tell a colleague. A speech-to-text model transcribes it and a LangGraph workflow turns it into a structured report, which is saved with the customer's record. On top of that, the tasks for the rest of the team come out of it on their own, such as sending a promotion, scheduling another visit or preparing a quote.
And before each visit there's a button inside the CRM they already used that generates a two-page summary. It tells you who you're going to talk to, what mattered most in the last visits, what they buy and whether they're buying more or less than before, so the salesperson walks into the meeting knowing who they're dealing with.
With this, around 30 hours of manual work are saved every month and every visit is documented. Recording two minutes of audio on the way out costs far less than sitting down to write the report at the end of the week.
- 30 h of manual work saved per month
- 100% of visits documented
Go to nodicus.com
Computer vision in hospital pharmacy
One of the projects we're currently working on at nódicus is a computer vision one, to supervise processes in a hospital pharmacy.
For those of you who aren't familiar with it, computer vision is the branch of AI that gets a computer to understand what it sees in an image or a video. And in this case we use it as an extra pair of eyes that never gets tired.
That said, the idea isn't to replace anyone. It's an extra layer of safety, and the person still has the final say (which at nódicus is a rule for every project).
For now I can't tell you much more, because the project is still ongoing and in a hospital confidentiality is taken very seriously. When I can, I'll tell you all about it.
Go to nodicus.com
Academic projects
An AI data scientist agent
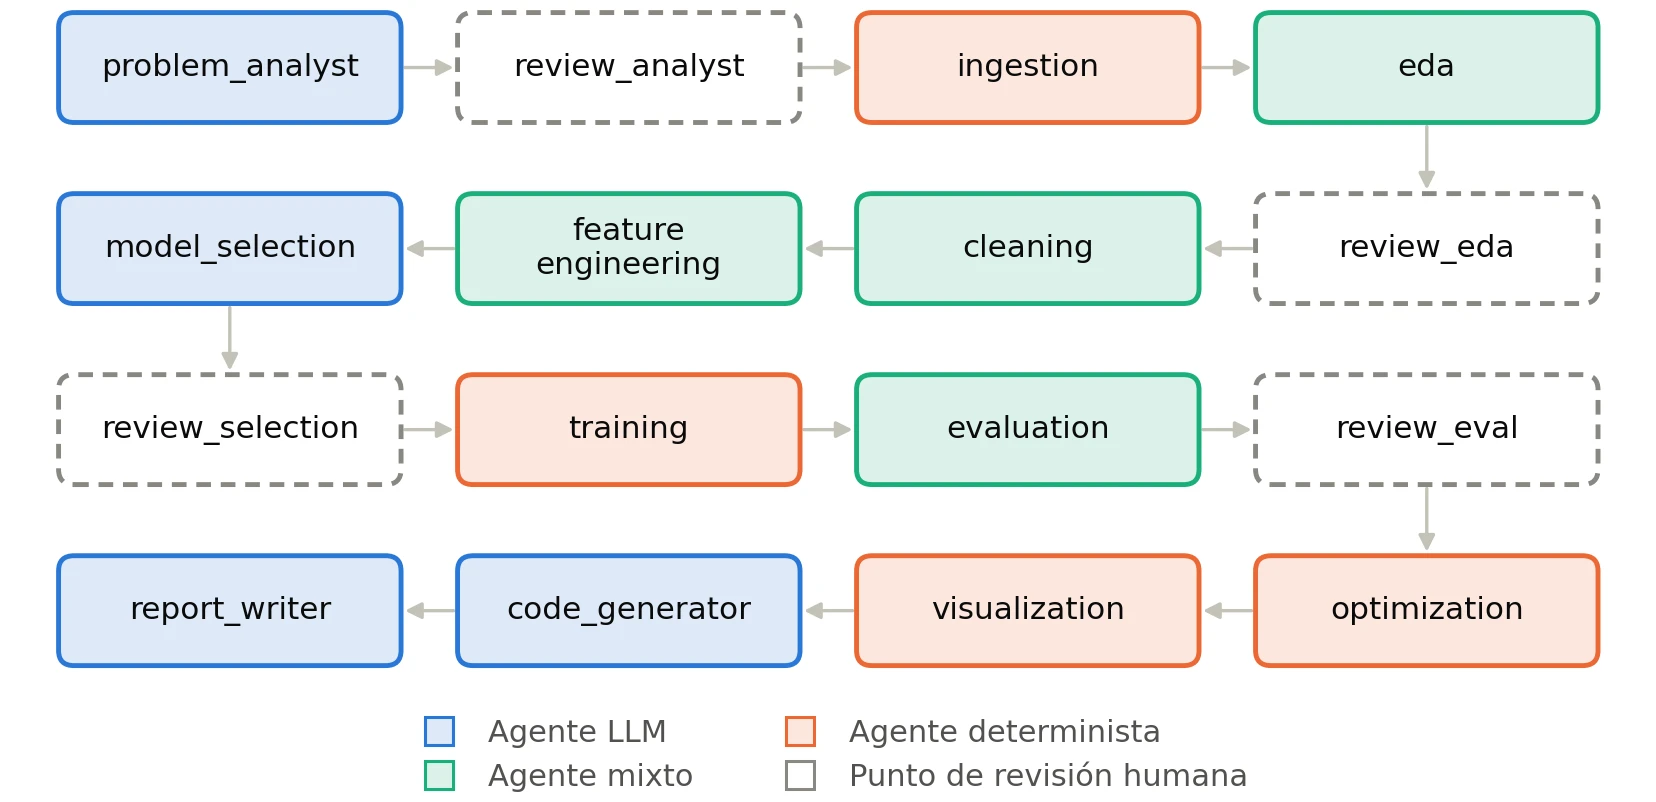
My Master's thesis for the AI master's at the UPV was about building the whole structure and workflow of an open, traceable agent that could act as a data scientist (let's see if I can put myself out of a job). The idea is that, starting from your data and your goal, it does all the work of a data science project from start to finish.
And although it may sound like AutoML 2.0, it really isn't, because AutoML is about optimising the choice of model and its parameters. But a data scientist's job goes much further. Cleaning data, understanding what is being asked (explained in natural language), joining sources that look nothing alike and, at the end, explaining the results to whoever has to use them. And for all of that a language model comes in very handy.
So I built it with LangGraph. A workflow of twelve nodes/agents covering every phase of a data science project, a critic agent that reviews the others' work and four checkpoints where a person reviews and decides before moving on. All with the model running locally, so your data never leaves your machine. That said, the language model doesn't do any maths. It decides what needs to be calculated and writes the code, but the metrics, the splits and the training come from running that code. If you let an LLM calculate an average for you, it might just make it up.
Then it had to be measured, which was the part that took the most work. I did 72 runs to compare three versions of the system, and I got a couple of surprises. The first was that the critic agent used 47% more tokens and didn't improve the score, so it wasn't worth it. The second was that the real weak spot was somewhere else, because of the 72 scripts it generated, 43 didn't even run. I added a loop that hands the error back to the model so it can fix it, and 69 ended up working.
On top of that, my own rubric couldn't tell systems apart (seven of its ten criteria always scored 1), so I built my own benchmark, DS-AUDIT, to compare it with other agents. Against AIDE, mine loses on performance but wins on reproducibility (full) and on data leakage (none).
And in the end, to work with real data, I'd rather have an agent I can trust than one that scores a little higher.
- 29 → 69 of 72 scripts that run
- 12 + 1 agents and a critic
- 1.00 reproducibility (AIDE: 0.27)
Read the thesis (in Spanish)
Atrial fibrosis with AI
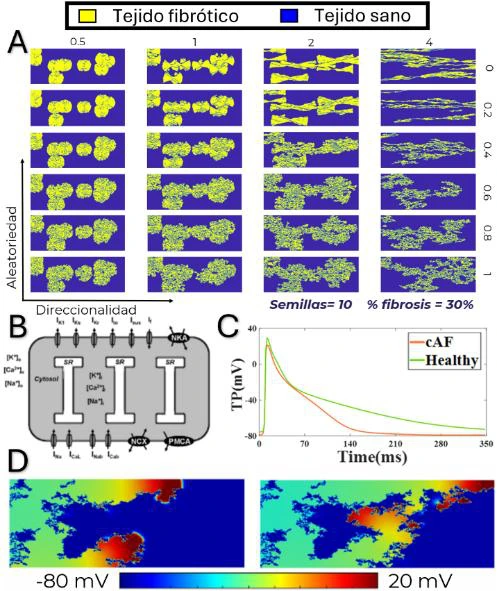
I did my bachelor's thesis at CoMMLab, a research group at the Universitat de València that simulates the electrical activity of the heart, and it's one of the projects I've put the most work into. It all started with a question. Can you tell how much fibrosis an atrium has just by looking at the shape of its electrical signal?
For those of you who aren't familiar with it, atrial fibrillation is an arrhythmia in which the cells of the atrium activate quickly and irregularly, and one of its causes is fibrosis, an excess of collagen in the atrial muscle that changes how electricity is conducted. Nowadays fibrosis is measured with contrast MRI or voltage maps, which are complex methods, need specialised equipment and whose effectiveness is disputed.
My hypothesis was that the shape of the signal (the electrogram) holds information about the tissue beyond its amplitude, which is the only thing voltage maps look at. The problem is that with real patients you never know exactly how much fibrosis there is, so it had to be simulated.
So I simulated 225 different atrial tissues, with between 5% and 25% fibrosis spread in different ways, and how electricity travels through each of them. On top of them I placed 132 virtual electrodes and extracted over 200,000 samples of unipolar, bipolar and omnipolar electrograms, which are the types used in clinical practice.
With all that I trained convolutional networks that, from a fragment of signal, decide which of five fibrosis levels the tissue is at. Looking at each signal on its own, the best model (the unipolar one) was right 71% of the time. But all the signals from one simulation share the same fibrosis, so if you pool their predictions and keep the most voted one, accuracy goes up to 91%.
That said, in a hospital you'll never have every signal from an atrium, so I tried more realistic ways of grouping them. With just 25 random signals, accuracy stays at around 89%. And taking one electrode and its 35 neighbours, which is closer to what a catheter measures, it's around 87%.
I published it as first author and presented it at the CASEIB 2025 conference in Zaragoza. It's done with simulated data and not patients, so it's only a first step and it would need validating with real clinical data. But if it worked, it could be built into the devices used during an ablation to estimate fibrosis on the spot and help clinicians during the treatment.
- 71 → 91 % accuracy: per signal and pooled
- 200,000+ electrograms
- CASEIB 2025 first author and speaker
Read the paper
Side projects
Programas 29N
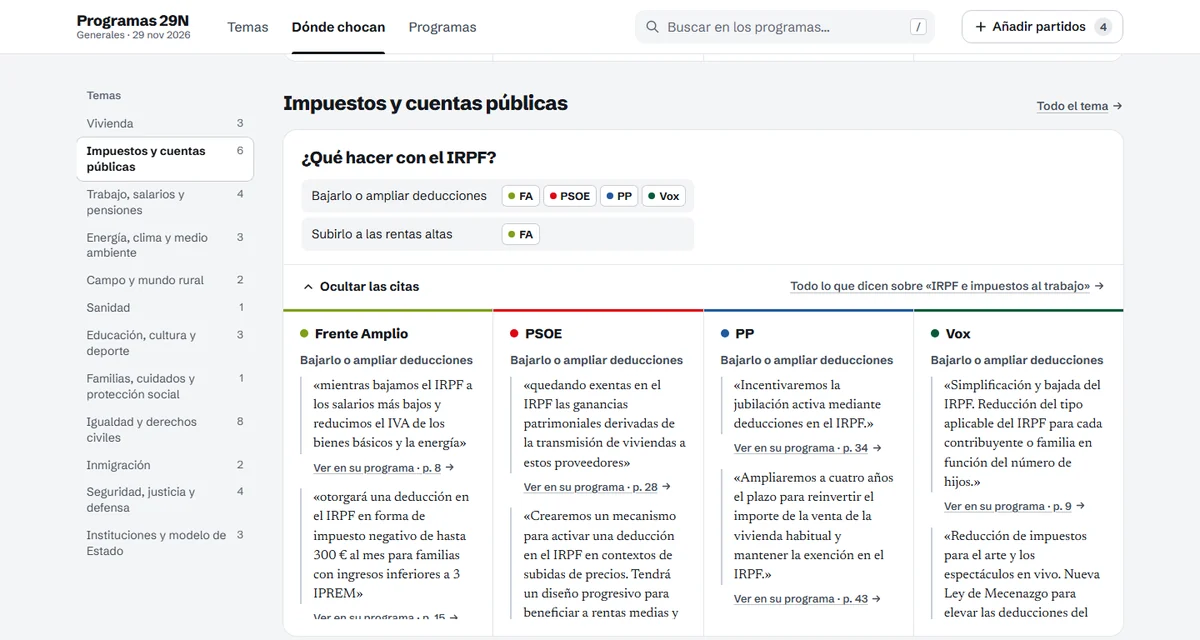
Before voting, I like to know what each party proposes. Not by listening to what a candidate blurts out in a debate or a twenty-second clip, but by paying attention to what's written in their manifesto. The problem is that hardly anyone reads them, and no wonder, because the manifestos of the four big parties alone add up to almost 400 pages.
So, for Spain's general election on 29 November 2026, I built a website that sorts them by topic. There are 17 sections and 111 subtopics, and in each one you get what every party says, side by side. There are also 40 questions where the parties disagree, like what to do with income tax or whether rents should be capped, with each party's position and the quote from its manifesto that backs it up.
The first step was turning the PDFs into text, which is harder than it sounds. Every party lays out its manifesto its own way (some are 15 pages long and some more than 150), so many of them needed their own clean-up. Then I split them into excerpts, each with the page of the PDF it comes from. And then a script checks that not a single line was lost along the way.
On the other hand, the headlines, the topic classification and the position on each question were made by an AI model (Claude). But here it isn't enough for it to be right most of the time, because we're talking about what each party stands for. So everything goes through validation scripts. Every excerpt has to end up in some subtopic and every quote has to appear word for word in the manifesto. That said, nobody touches the parties' text, neither the AI nor me. It's not summarised or corrected, and on the site you can tell at a glance what's theirs and what I added.
And since neutrality is everything in an election, every party gets the same size and the same visual weight. The site doesn't tell you who to vote for. It shows you what each one has promised, so you can decide.
Because a manifesto is (or should be) what the party will do if you vote for it. And to demand they deliver on it, you first have to read it.
- 12 party manifestos
- 4,215 excerpts, all verbatim
- 40 questions where they clash
Go to the site (Spanish) · See the code
Tesla Runner
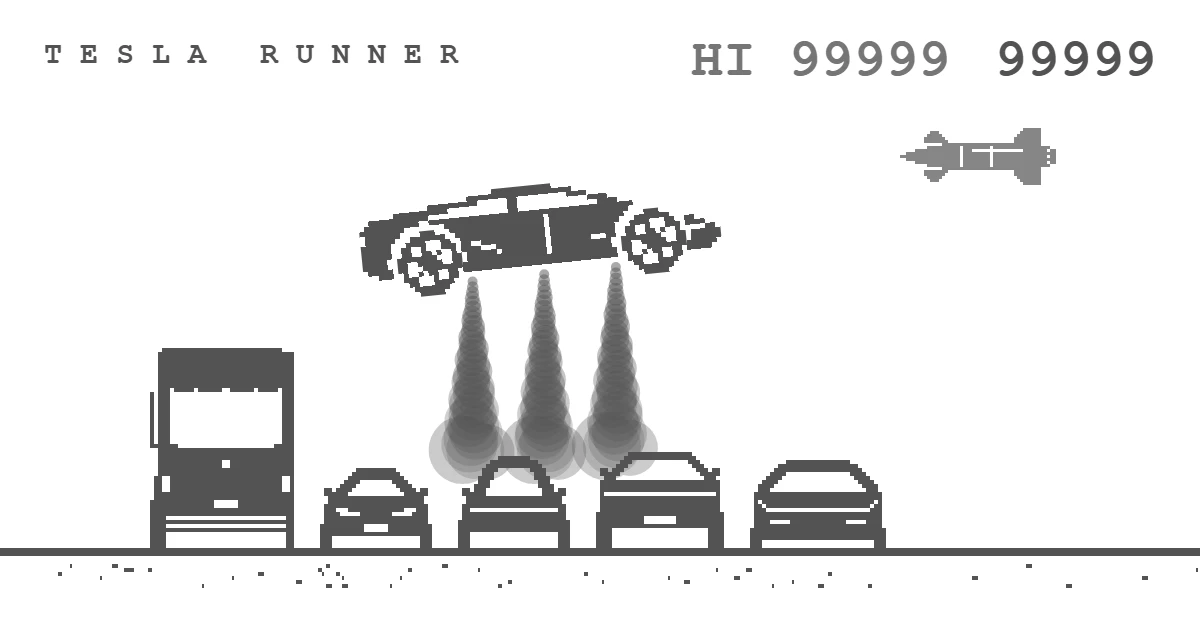
What happens if you give the Chrome dinosaur a Tesla Roadster (a.k.a. the car that flies)? Instead of jumping cacti, you jump trucks and Starships.
It all started in October, when the new flying Roadster had just come out. On Twitter I saw a faked image of the dinosaur game, but with a Tesla, and it made me laugh so much I told myself I had to build it. One day later it was done, all in a single HTML file, with no dependencies at all.
To make it feel just like the original, I took the physics from the source code of Chrome's T-Rex (gravity, speeds, gaps between obstacles). And then I added everything it was missing. For example, hold the jump and you fire the thrusters, there are giant ramps that turn you upside down and flips and barrel rolls score points (but land badly and you blow up). It also has touch controls so you can play on your phone and a TOP 100 with the best scores.
I challenge you to get into the TOP 100. How many points can you get?
- 1 day to build it
- 1 HTML file
- 0 dependencies
Play · See the code
Seagull 3D
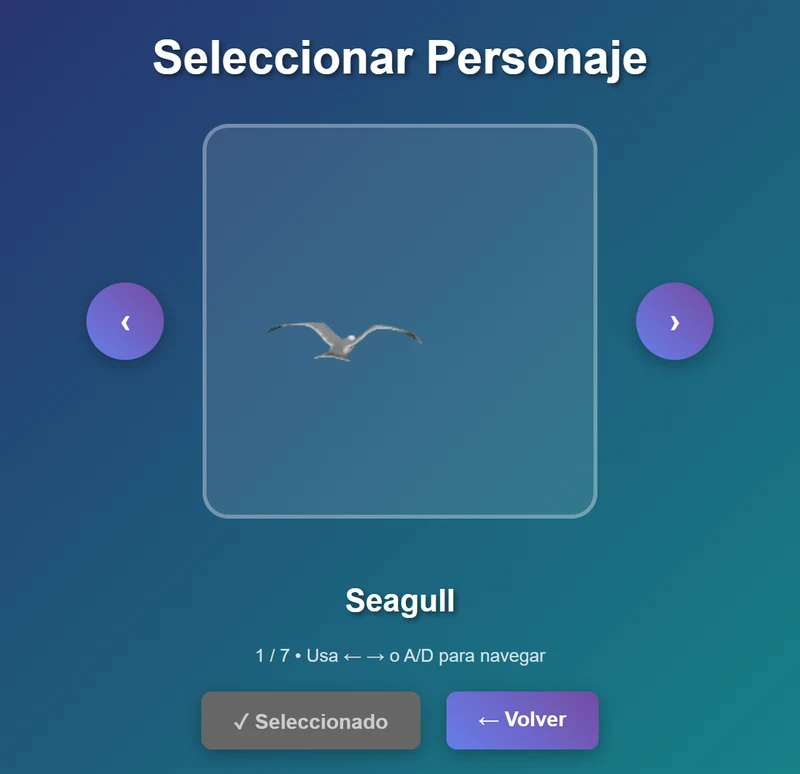
In the Computer Graphics course of my AI master's at the UPV we had to build a three.js project, and mine is called «¡ME CAGO EN TODO!» (roughly, "I poop on everything"). The title sums it up pretty well, because you're a seagull flying over a city and your goal is to poop on everyone who walks below.
But behind the joke there's quite a lot of work. The city has hundreds of buildings with shadows, drawn with instancing (rendering many copies of the same object in one go) so it doesn't crawl. There are seven birds to choose from, each with its own speed and ammo, from the hummingbird to Charizard. The pedestrians are animated, they panic and scream with positional sound, so you hear them from where they are. And it also has a minimap and an eagle view.
The best part is that the pedestrians are my classmates, names and all. When you hit one, a notification pops up (so you can gloat). And if you eat a kebab, you get ten seconds of… let's say extra ammo.
I got a matrícula de honor (the top grade, with distinction) in that course. You play it in the browser, so you can try it yourselves (careful with the kebab).
Play · See the code
This room
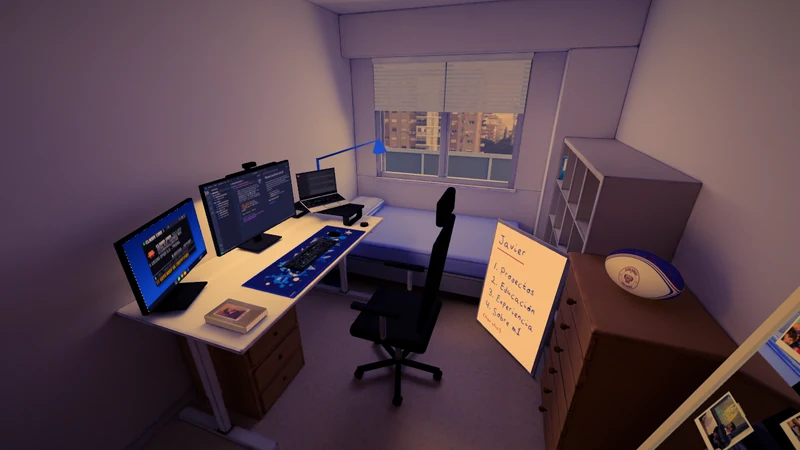
Portfolios tend to all look the same: a photo, four projects on little cards and a contact button. And hey, they work. But I fancied something different.
And after thinking it over, I realised that my bedroom is one of the things that best represents me. It's where I've spent a big part of my life. So what better way to introduce myself than to invite you into my room.
And since I'm someone who takes attention to detail to the limit, I wanted to recreate my real room. With its real measurements, all my furniture and my setup. Nothing is modelled by hand, the whole room comes out of a Python script for Blender that builds each piece of furniture in code, and the lighting is calculated by Cycles and baked into day, sunset and night textures. But that's just the base, because then came the fun part.
To introduce myself, both personally and professionally, I designed several sections: projects, experience, education and about me; and I linked each section to an object in my room (the monitor, the window, the book on the desk and the mirror), so that clicking it tells you that part of me. Each section is custom-made, trying to fit perfectly with its object and with what it's meant to convey.
But since this is something I do purely for fun, I decided it didn't end there. Even though they serve no useful purpose, I added other kinds of interactions: easter eggs (like the rugby ball), interactions with the room (like the blinds) and interactions with the real world (like the weather through the window, which is Valencia's weather right now, or the sun, which comes in according to the real time of day). All of that is driven by three.js in the browser, and the scene is only redrawn when something changes, so it runs smoothly on any computer and on mobile too.
The idea of this project is to make a personal page that represents me beyond my academic and professional background. A place where you can get to know me as a person, that's alive and can keep evolving. And above all, the goal was to make something I liked.
- 1:1 real room measurements
- 0 objects modelled by hand
See the code
Experience
Co-founder and AI engineer · nódicus
Since Oct 2025
In October 2025 I founded nódicus with Pedro de Luna, another data scientist from Valencia. We build custom artificial intelligence solutions for companies, whether with machine learning, deep learning, computer vision or agents built on language models.
As there are only two of us, I take part in every phase of each project. From the first meeting with the client, where we try to understand their business and their data, to the proposal, development, deployment and support afterwards (so one day I'm coding and the next I'm putting together a proposal).
And what I like most is that every project starts with understanding a business that isn't ours. For example, we've worked for a truck workshop that had to code its warranties, for a distributor whose salespeople spent one week out of two at the office writing reports and for a hospital pharmacy. They're worlds that have nothing to do with each other, and in each one you have to turn their problems into an AI problem that can be solved. In fact, that part is usually harder than the technical one.
On top of that, we work by two principles that never move. The first, that every result can be traced back to the data it comes from, so nobody has to trust a black box. The second, that the last word always belongs to the person using the tool, because the AI proposes, but they're the one who knows the business.
On the other hand, starting a company forces you to learn things that never come up in a degree, like preparing a proposal, putting a price on a project or explaining to someone non-technical why AI is worth bringing into their company (or why it isn't). And if you have a problem you think AI could solve, you know where to find us.
Deep learning researcher · CoMMLab, Universitat de València
Jan – Jun 2025
For my bachelor's thesis, from January to June 2025 I was part of CoMMLab, a research group at the Universitat de València that simulates the electrical activity of the heart.
My supervisor was Miguel Rodrigo, and every week the whole group met. Each of us presented our progress and we discussed it together, so there was no way to hide a weak result (nor any wish to).
In my case, the work was about finding out whether you can estimate how much fibrosis an atrium has just from the shape of its electrical signal. To do that I simulated 225 atrial tissues, extracted over 200,000 electrograms and trained convolutional networks that got it right 91% of the time when pooling the predictions of each simulation (I tell you more about it in the projects section).
I learnt a huge amount there, both from my own work and from my colleagues'. For example, I learnt that in research you have to be able to defend every result in front of people who know more than you, and that an "I think it works" is no good if you can't prove it. I also had to dive headfirst into a field that wasn't mine, cardiac electrophysiology, and understand enough medicine for what I was doing to make sense.
In the end, the work led to a paper that I presented as first author at CASEIB 2025, the annual conference of the Spanish Society of Biomedical Engineering, in Zaragoza. And honestly, I really enjoyed presenting it (the theatre may have something to do with it).
Data scientist (internship) · Diputació de València
Oct – Dec 2024
I did my degree internship at the Diputació de València, as a data scientist, from October to December 2024. It was the first time I worked as a data scientist outside university, and in a team of three people too.
We worked with data from sensors that detect how many people pass through different areas of Valencia and the Valencian Community. The idea was to understand how people move from one municipality to another and which areas behave alike, something a public institution finds very useful to know.
To do that we split the data into 10-minute windows, calculated the trips between each pair of municipalities over different time spans (from 20 minutes to a week) and added everything that could help explain them, such as distances, the time of day or whether it was a public holiday.
And to group them we designed R-HDBSCAN, a recursive variant of the HDBSCAN clustering algorithm. For those of you who don't know it, HDBSCAN groups data that look alike without you having to tell it how many groups you want, but with so much data it can easily give you groups that are too big. So we applied it again and again to the groups that came out, until we were left with small groups that made sense (you'll find all the details in the projects section).
On top of that, as there were three of us, we split the work and pooled it together, so I learnt to coordinate with other people on a real data project, with its deadlines and its surprises.
Software developer · Pksiam
Sep 2022 – Jul 2023
My first job as a programmer was at Pksiam, a company that builds custom web solutions for hospital pharmacy. I was there from September 2022 to July 2023, combining it with the second year of my degree (which translated into quite a lot less sleep).
Generally speaking, a hospital pharmacy is nothing like the pharmacy round the corner. It prepares and keeps track of the medication for inpatients, and for that it needs software made to measure.
There I worked on both the frontend, with HTML, CSS and JavaScript, and the backend, with C# and SQL. In other words, from what the user sees on screen to the database queries behind it.
It was my first experience of software development in a professional setting. For example, I learnt that code doesn't just have to work, it also has to be understood by whoever touches it next, and that when an application is used every day in a hospital, bugs can't wait until tomorrow.
More about me
Rugby
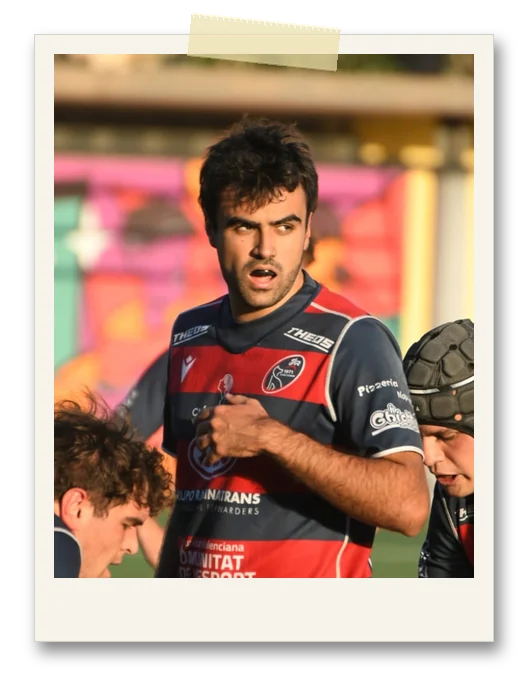
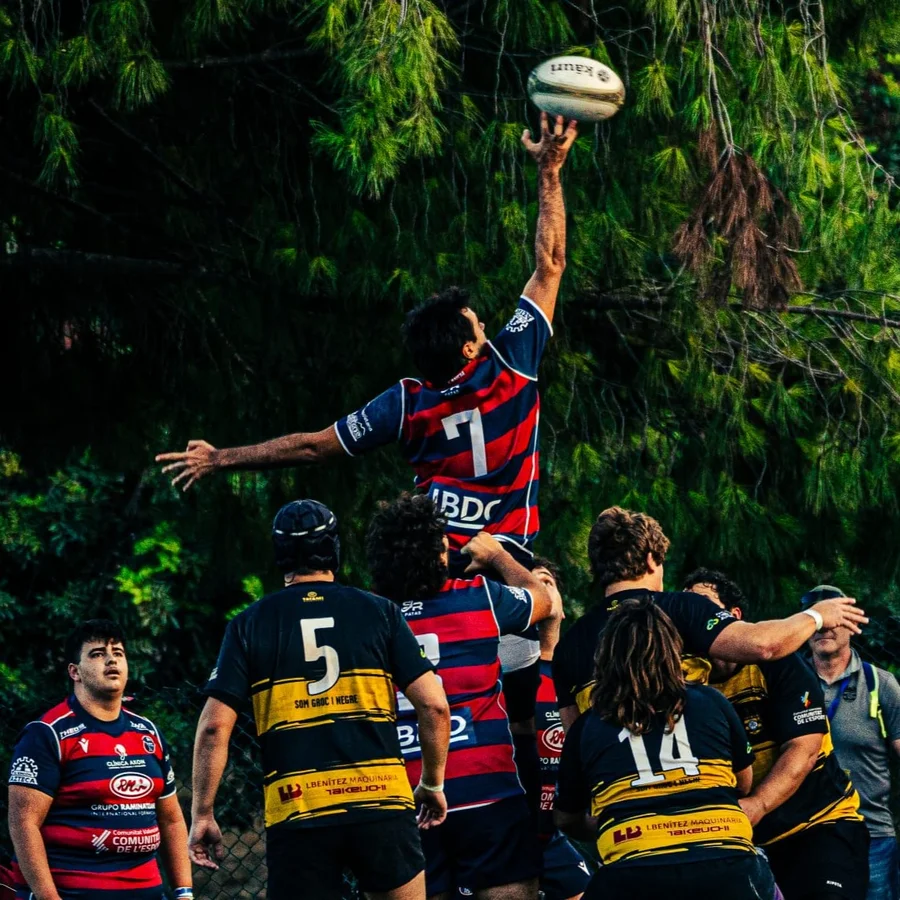
One of my passions is rugby. I started playing in the third year of ESO (in 2017) and I have not stopped since. I play for Club de Rugby San Roque, as a flanker (6/7).
Respect
One of the things rugby has instilled in me the most is respect: respect for the referee, the coach, my teammates and my opponents. For example, in rugby players cannot talk to the referee, only the captain can, and he has to do it very politely, because shouting at or insulting the referee means a direct card.
Team
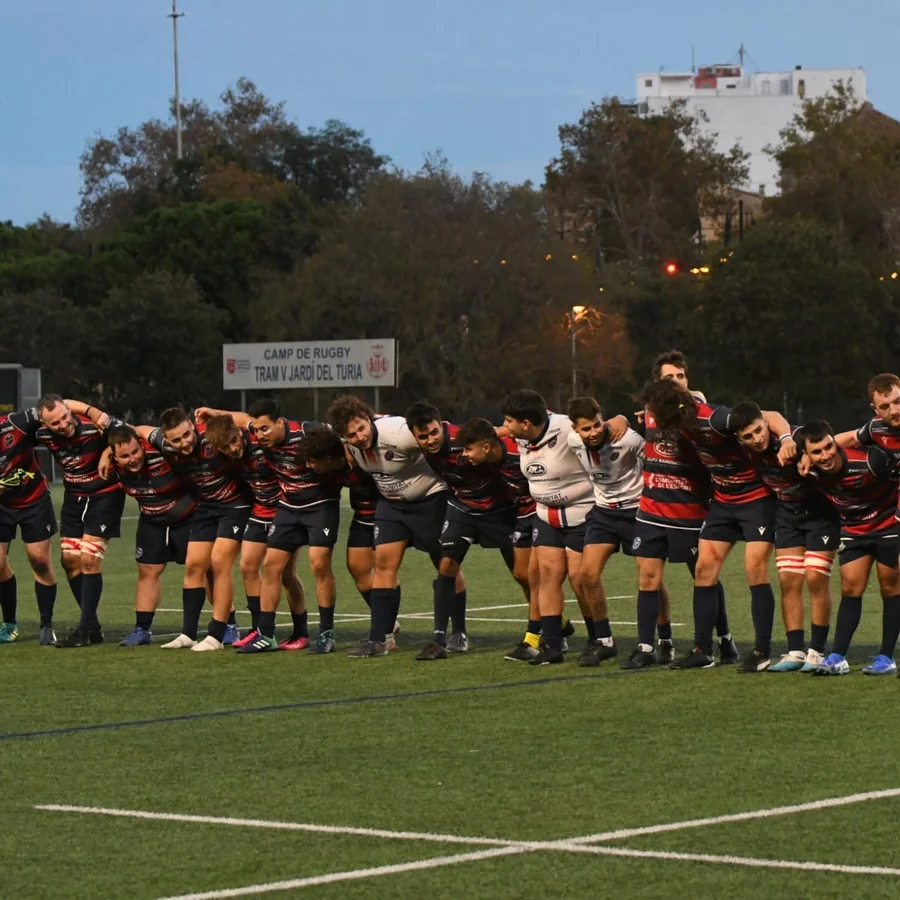
On the other hand, something I consider fundamental about rugby is that it is the team sport par excellence. On the pitch, egos are left behind and we become one unit. In fact, it is one of the few sports with no personal names or shirt numbers. The 15 starting players wear numbers 1 to 15 depending on the position they take. There are no stars, only pieces of a common gear.
Besides, rugby is a sport for anyone. It does not matter whether you are tall or short, heavy or thin, quick and agile or strong and determined. There will always be a role for you. The forwards (or "fatties", an affectionate nickname for the players from 1 to 8) are the power of the team. They tackle and crash into the other team's forwards and create space. And then come the backs (players 9 to 15), who run through that space to break the defensive line and score a try.
University Sevens
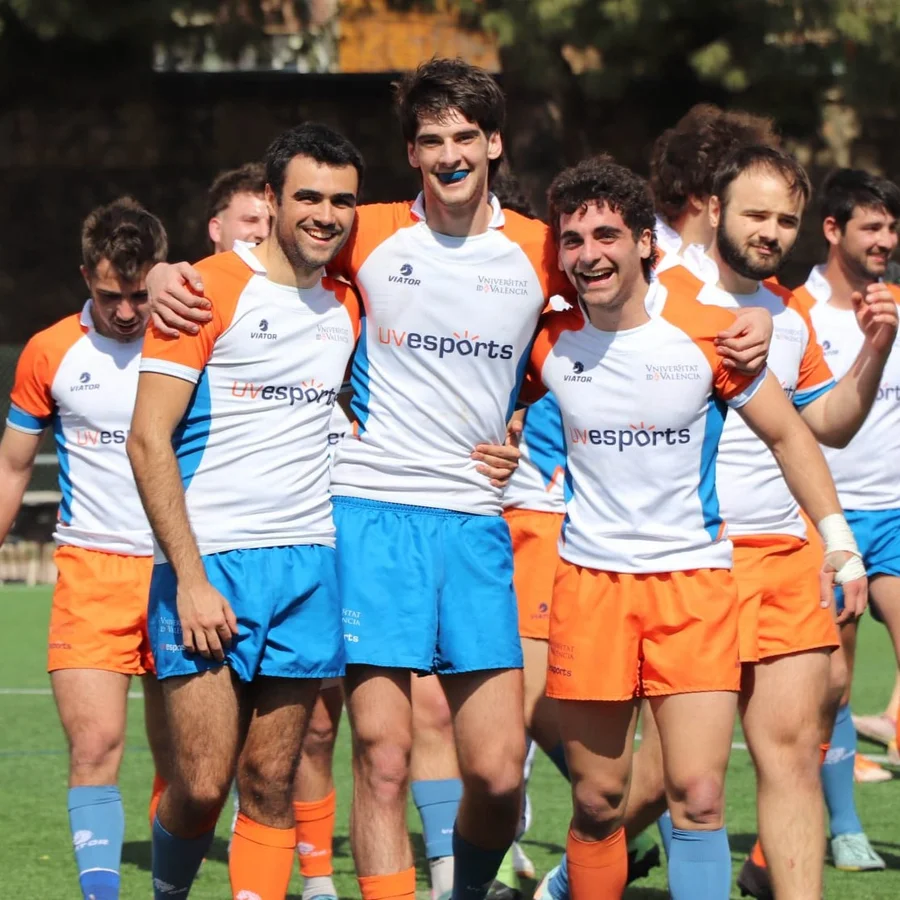
Rugby has also been with me at university. I spent two years in the University of Valencia rugby sevens team and we won the Valencian university championship (the CADU) both years, two golds. Both years we went to the Spanish University Championship (CEU), and the first year we finished third, with the bronze. And when I went on Erasmus to Rome I also played for the Sapienza sevens team, with which we went to a tournament, the WIUC.
Hackathons
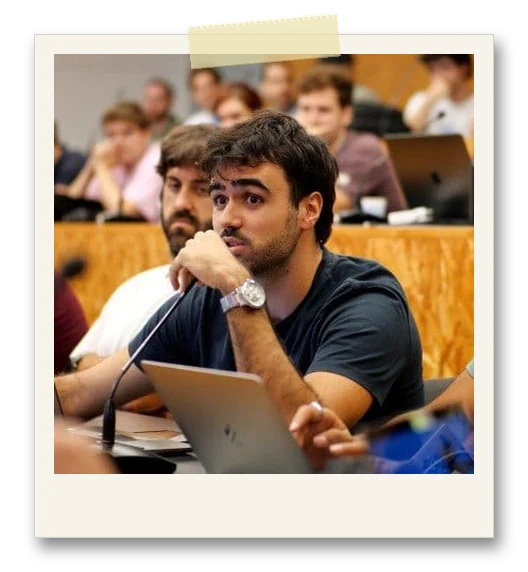
Among my many hobbies, one I love is going to hackathons.
What are they?
For those who do not know them, hackathons are events where teams try to solve a problem in a few hours and present the solution to a jury at the end of the event.
What I like most
What I like most about hackathons is that you meet a lot of nice, good people. I have come across very ambitious people, eager to build and to experiment, and that makes my day. I also love facing new and unknown challenges, thinking and challenging myself towards cognitive innovation.
The professional side
On the professional side, it is great because you do networking and meet many companies that bring the problems they have, which lets you see far beyond what you know and understand what is going on in other sectors or niches.
My role in the team
I am very good at leading teams, and also at adapting and playing the role the team needs from me, whether that is taking the reins, delegating or pushing my teammates' ideas. I am also a very good speaker, and I usually do the final pitches. Thanks to my theatre experience, I really enjoy speaking in front of an audience and trying to convey everything we have built as a team during the hours of the hackathon.
My hackathons
Travel
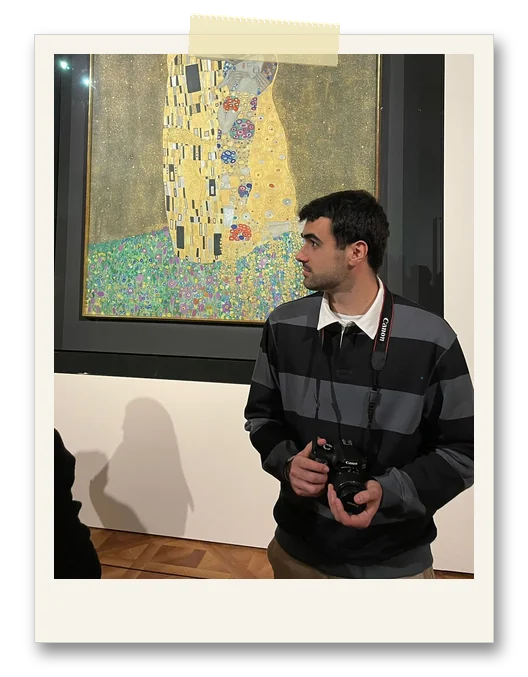
I love travelling. Getting to know other cultures, other places and other cuisines has pushed me to move and go out to see the world. So far I have visited 19 countries ... and counting!
Countries I have visited (19):
- Canada
- Norway
- France
- Thailand
- Austria
- Hungary
- Germany
- Croatia
- Luxembourg
- Portugal
- Spain
- Ireland
- Italy
- United Kingdom (England)
- Slovakia
- Czechia
- Morocco
- Andorra
- Vatican City
History
When I visit a city, a monument or a museum, what I like most is hearing the story behind it. Not the factual data, but the narrative that surrounds it. Between free tours, audio guides and what Wikipedia says, I stuff myself with information until it comes out of my ears.
Nature
But I do not only like travelling to cities. Another thing I love is getting to know the nature of the places I travel to. Whether it is beach or mountains, seeing landscapes so different from what I am used to in Spain fills me with immense wonder and peace. And when I travel I try to find out about the natural treasures of the country so I can do a route or an excursion and enjoy them.
Food
And of course, as a Spaniard who loves good food, one of the things I like most about travelling is trying other cuisines. I always try to taste the core of the cuisine of the country I visit, at every level, from street food to the best restaurant dishes (while trying not to get ripped off, because I am not made of gold).
PS: The photo in this section was taken at the Belvedere museum in Vienna, next to Gustav Klimt's painting "The Kiss", a copy of which has hung above the sofa in my living room all my life.
Books I have read
Currently reading: Moby Dick, Herman Melville.
Already read:
- Crónica del rey pasmado, Gonzalo Torrente Ballester